|
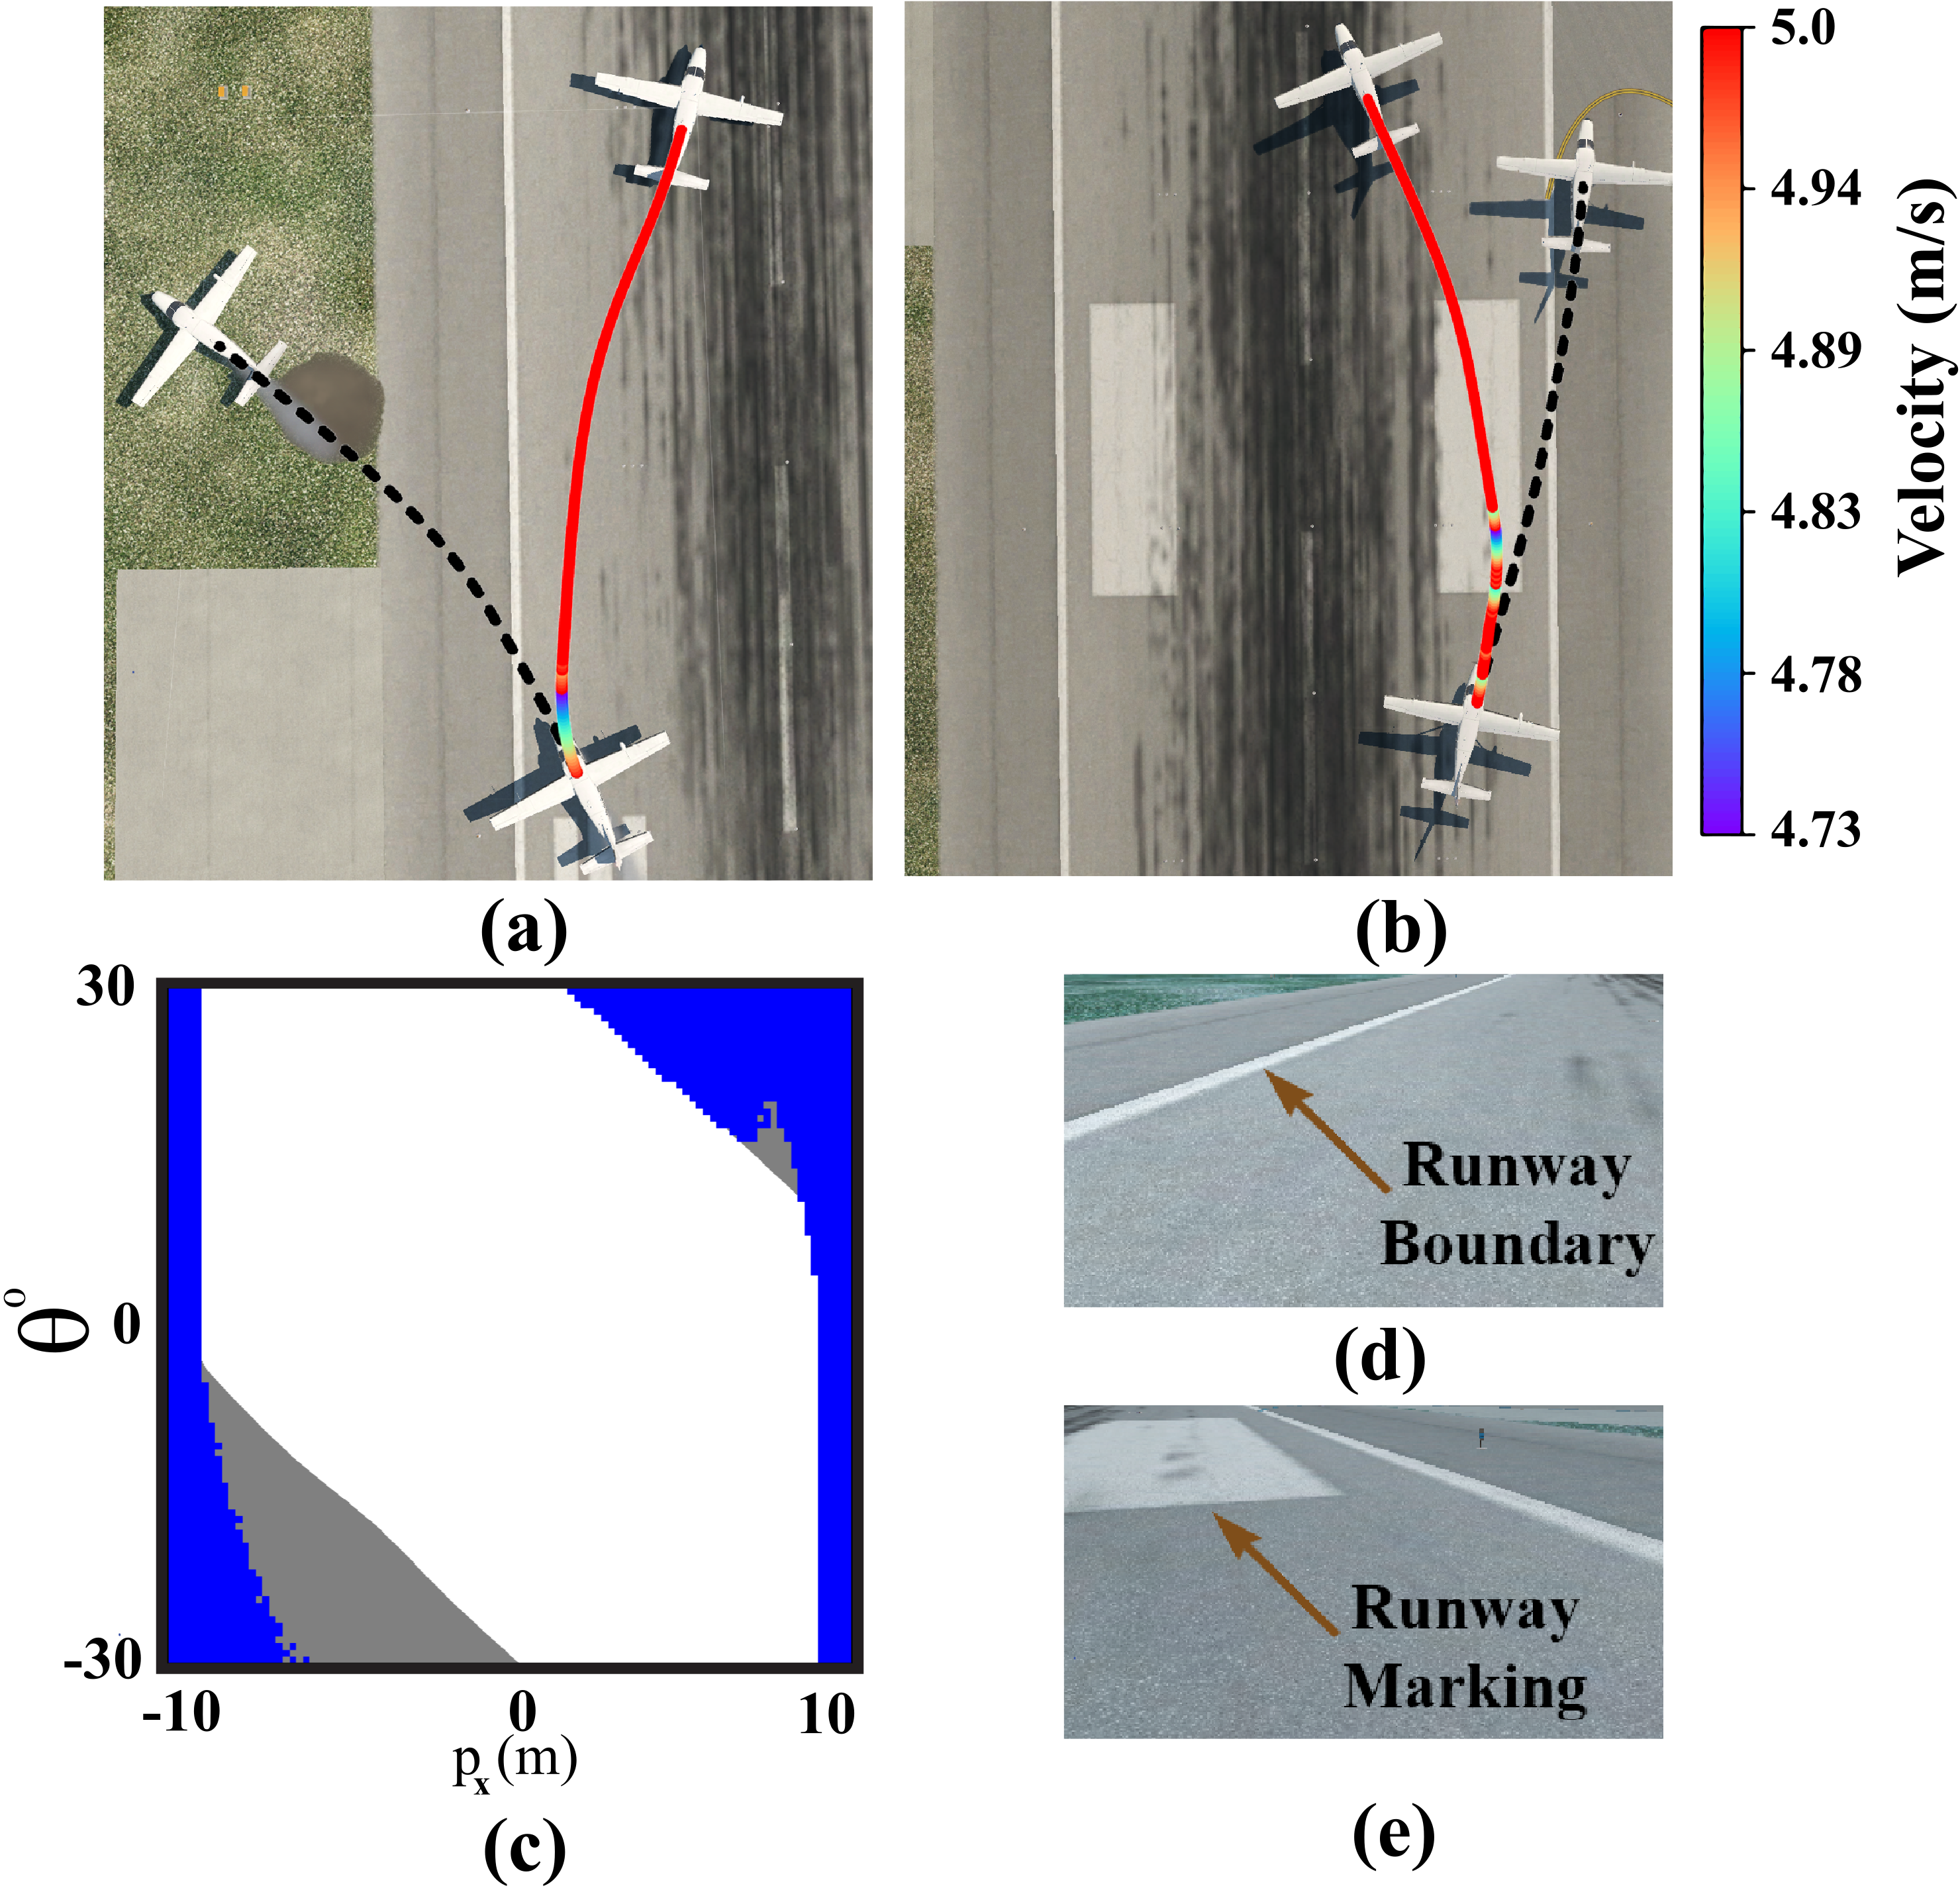
Fig. (a, b) Trajectory followed by the aircraft under the TaxiNet
controller (dashed black line) and the safety pipeline (red line).
The color shift in the red curve shows velocity variation due to
the fallback controller. (c) The grey region represents the system
BRT under the TaxiNet controller, and the blue region represents
the BRT under the safety pipeline. The BRT obtained using the
AD and the fallback controller is appreciably smaller than the one
obtained using vanilla TaxiNet. (d) Input image at the start state
in (a), causing system failure due to runway boundaries. (e) Input
image at the start state in (b), causing system failure due to runway
markings.
|

